Steam Adds In-Game Overlay Performance Monitor to Help Players Identify Causes of Poor Operation
|
|
Key points
- The In-Game Overlay Performance Monitor was introduced by Valve as part of a new Steam client on June 30, 2025.
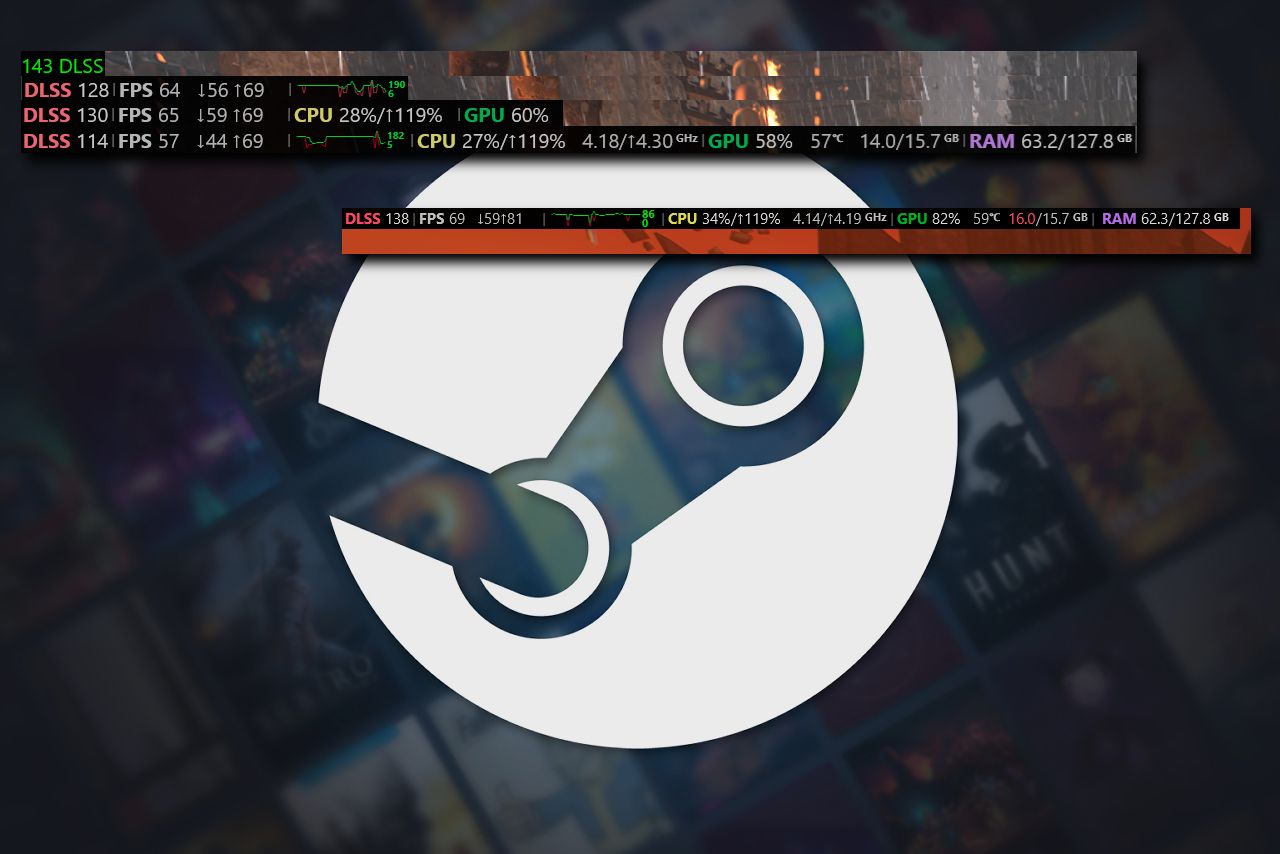
- The feature can display detailed performance data on frames per second, CPU, GPU and RAM in the corner of the player’s screen in real time.
- The Steam In-Game Overlay Performance Monitor can identify frame generation technologies like DLSS and FSR frame generation.
The In-Game Overlay Performance Monitor was introduced by Valve as part of a new Steam client on June 30, 2025.
According to Valve, the feature is designed to help better understand how a game is running, what type of load it is putting on the system and whether the hardware is performing as expected. It can display detailed performance information about FPS, CPU, GPU and RAM in the corner of the player’s screen in real time, shown as a thin line.

Steam’s In-Game Overlay Performance Monitor can identify frame generation technologies like DLSS and FSR frame generation. It shows detailed stats, breaking down the FPS from these technologies separately, as well as the actual game FPS, measured over one-second intervals. The overlay feature also shows the minimum and maximum frame performance of the game within one-second intervals.
As for FPS stats, the In-Game Overlay Performance Monitor shows them as a graph with the average FPS over one-second intervals across a 90-second timeframe in green. If any minimum FPS values are low enough to be concerning, they appear in red on the graph. The small numbers on the right side of the graph indicate the current y-axis range, which automatically adjusts based on the FPS values within that 90-second window.
The new feature measures the amount of work the CPU is doing, scaled to its base clock rate, and presents the stats in two sets of numbers. The first set includes the average processor utility across all cores, sampled from Windows once per second, and the processor utility value for the single most utilized core at the time of sampling. The second set of CPU numbers shows the exact level of the processor’s boosting, with the first number representing the average across all cores and the second showing the highest core boost at each one-second sampling interval.
As modern systems can have multiple GPUs with several engines each, the monitor shows a single utilization number (the first one in the GPU indicator section) by checking all GPUs and their engines, picking the busiest one, usually the 3D engine on the main GPU, matching the method of Windows Task Manager. The second number is the GPU’s temperature, taken from the hottest sensor available on the card if the GPU is from a supported vendor. The last paired set of numbers in the GPU indicator displays GPU memory usage of the total amount.
The RAM section, in turn, shows the currently used amount of physical system memory versus the total amount the system has.